Breaking Even
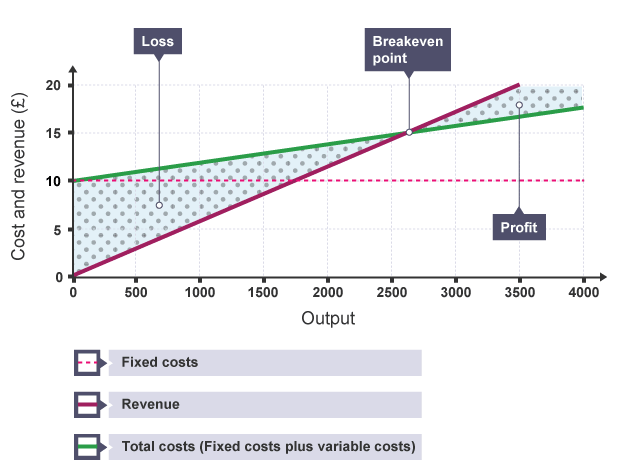
At low levels of sales, a business is not selling enough units for revenue to cover costs. A loss is made. As more items are sold, the total revenue increases and covers more of the costs. The break-even point is reached when the total revenue exactly matches the total costs and the business is not making a profit or a loss. If the firm can sell at production levels above this point, it will be making a profit.
Establishing the break-even point helps a firm to plan the levels of production it needs to be profitable.
The break-even point can be calculated by drawing a graph showing how fixed costs, variable costs, total costs and total revenue change with the level of output.
Here is how to work out the break-even point - using the example of a firm manufacturing compact discs.
Assume the firm has the following costs:
Fixed costs: £10,000. Variable costs: £2.00 per unit
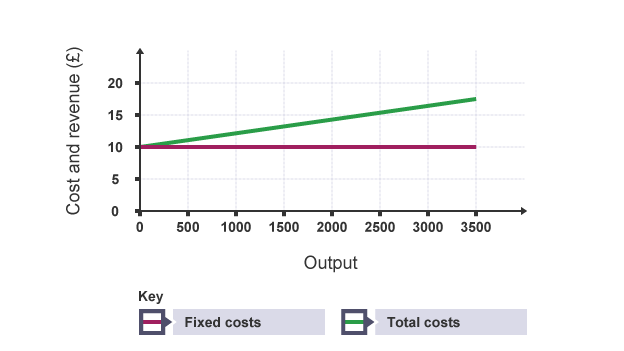
First construct a chart with output (units) on the horizontal (x) axis, and costs and revenue on the vertical (y) axis. On to this, plot a horizontal fixed costs line (it is horizontal because fixed costs don't change with output).
Then plot a variable cost line from this point, which will, in effect, be the total costs line. This is because the fixed cost added to the variable cost gives the total cost.
To calculate the variable cost, multiply variable cost per unit x number of units. In this example, you can assume that the variable cost per unit is £2 and there are 2,000 units = £4,000.
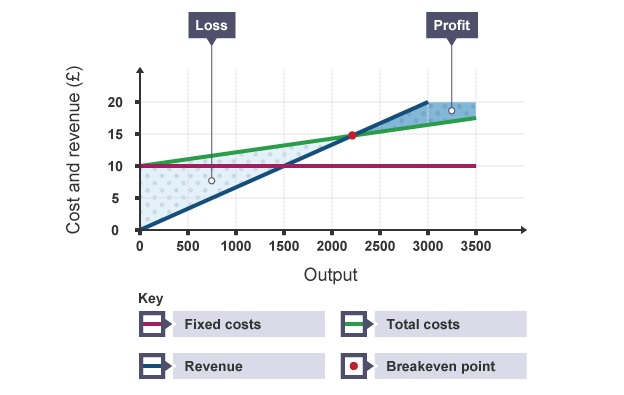
Now plot the total revenue line. To do this, multiply:
sales price x number of units (output)
If the sales price is £6 and 2,000 items were to be manufactured, the calculation is:
£6 x 2,000 = £12,000 total revenue
Where the total revenue line crosses the total costs line is the break-even point (ie costs and revenue are the same). Everything below this point is produced at a loss, and everything above it is produced at a profit.
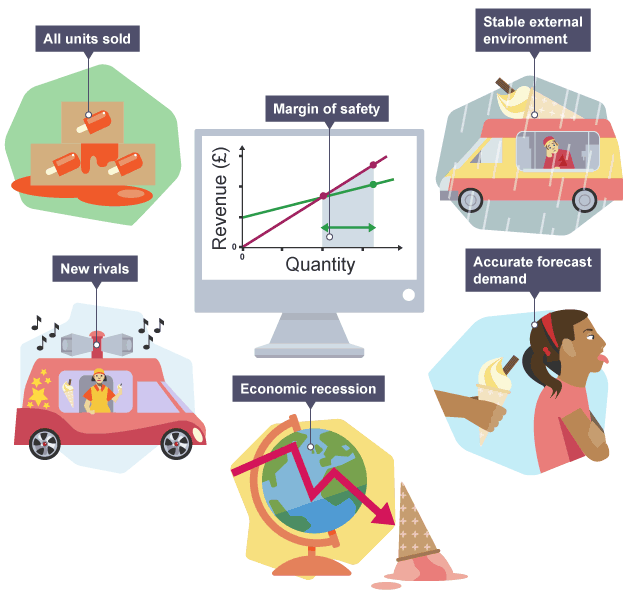
Break-even analysis is a useful tool for working out the minimum sales needed to avoid losses. However, it has its limitations. It makes assumptions about various factors - for example that all units are sold, that forecasts are reliable and the external environment is stable. If new rivals enter the market or an economic recession starts then it could take longer to reach the break-even point than anticipated.
Many organisations add on a margin of safety to the break-even level of output when deciding on their minimum sales target.
sales price x number of units (output)
If the sales price is £6 and 2,000 items were to be manufactured, the calculation is:
£6 x 2,000 = £12,000 total revenue
Where the total revenue line crosses the total costs line is the break-even point (ie costs and revenue are the same). Everything below this point is produced at a loss, and everything above it is produced at a profit.
Break-even analysis is a useful tool for working out the minimum sales needed to avoid losses. However, it has its limitations. It makes assumptions about various factors - for example that all units are sold, that forecasts are reliable and the external environment is stable. If new rivals enter the market or an economic recession starts then it could take longer to reach the break-even point than anticipated.
Many organisations add on a margin of safety to the break-even level of output when deciding on their minimum sales target.